OpenTelemetry 도입기
팀에서 Kubernetes를 도입한 이후 관리하고 있던 서비스들의 MSA 전환이 활발히 이루어지고 있습니다. 하지만 전환이 가속화 될수록 서비스간 연결이 복잡해졌습니다. 또한 Filebeat와 Metricbeat로 수집하며 파편화된 정보는 인입된 CS를 분석하기에 매우 힘들고 불필요한 시간을 보내왔습니다. 그러던 중 사람인에서 Observability 환경을 구축했다는 소식과 일부 서비스에서 도입 후 긍정적인 평가를 보여주어 적용을 검토하게 되었습니다.
OpenTelemetry란
OpenTelemetry는 클라우드 네이티브 컴퓨팅 재단(CNCF, Cloud Native Computing Foundation)에서 두 번째로 큰 프로젝트로 2026년 3월 기준으로 Incubating 단계이며, 2024년 3월에 졸업 신청(Graduating Application)하여 심사 진행중입니다. 하지만 커뮤니티와 기업들 사이에서는 이미 사실상의 Observability의 표준으로 대우받고 있으며, 사람인에서도 OpenTelemetry와 SigNoz를 조합하여 구축하여 운영하고 있습니다.
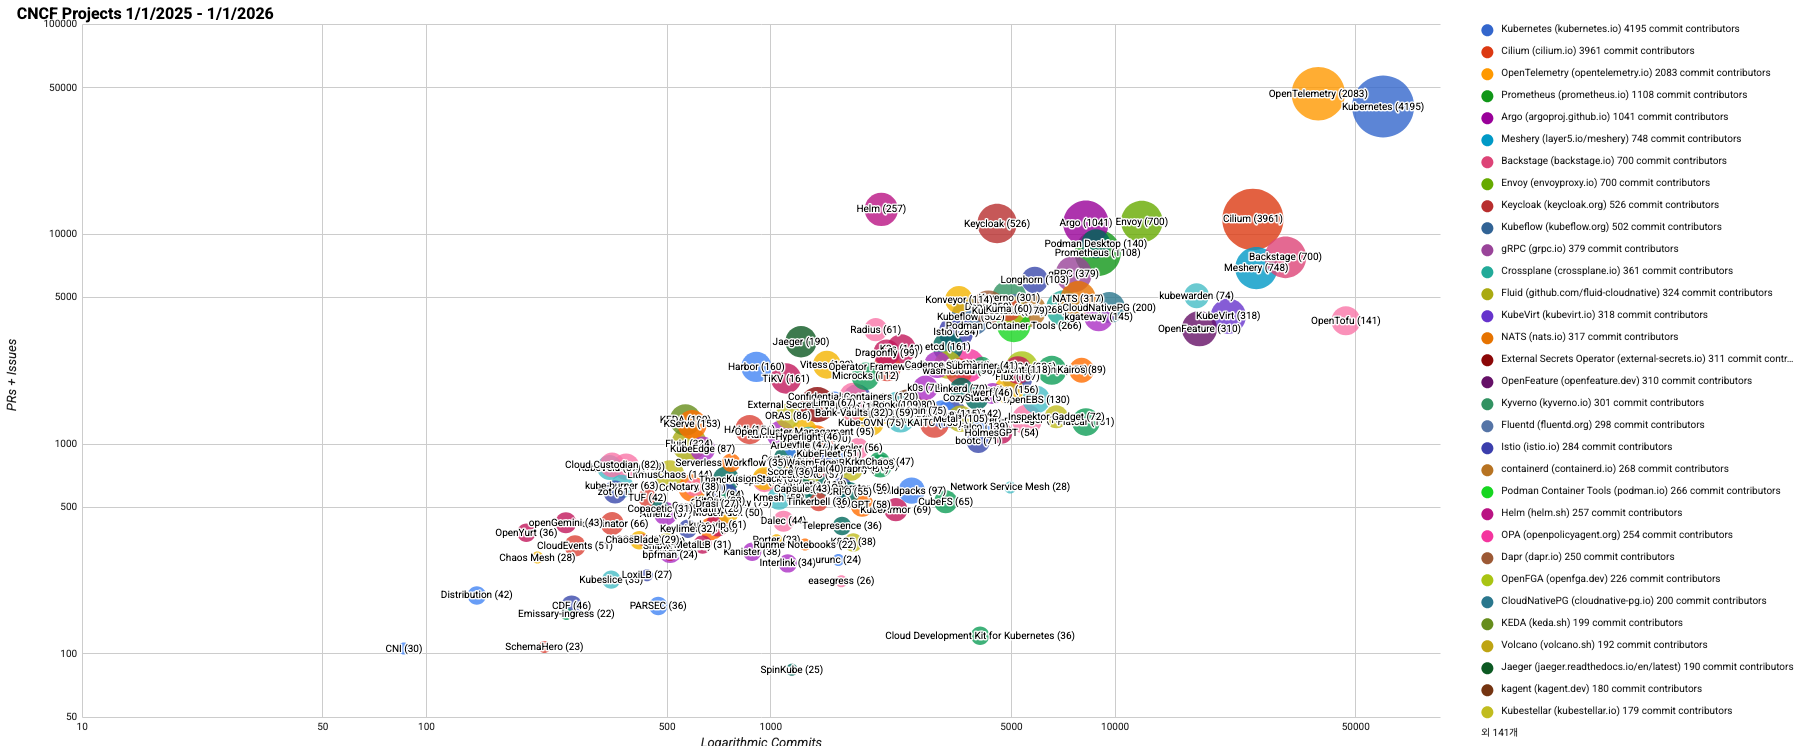
2025년도 CNCF 프로젝트 활동 및 성장 추세를 시각화한 자료, 출처: https://github.com/cncf/velocity?tab=readme-ov-file
OpenTelemetry가 등장하기 전에는 MLT(Metrics, Logs, Traces) 수집에 있어 각기 다른 도구와 방식으로 수집했습니다. 또한 도구마다 자체 SDK와 에이전트가 있어 개발자의 추가적인 노력과 측정 데이터의 불일치로 도구 전환과 데이터 통합에 어려움이 있었습니다. 하지만 OpenTelemetry가 등장하면서 한 번만 계측하면 어디로든 보낼 수 있게(instrument once, export anywhere) 되었습니다. 그리고 통합된 관찰 가능성(Unified observability), 일관된 데이터(Consistent data), 단축된 평균 복구 시간(Faster MTTR), 유연성(Flexibility), 비용 최적화(Cost optimization)라는 베네핏을 제공하였습니다.
우리도 이 혜택을 누리기 위해 OpenTelemetry를 도입하였고, 어떻게 적용하였는지 과정을 살펴보겠습니다.
Operator
Kubernetes는 CR(Custom Resource)를 정의하고 Custom Controller를 활용하여 애플리케이션과 그 구성 요소를 자동으로 관리하는 Operator pattern 개념이 있습니다. 이 개념을 사용하여 우리는 2가지 핵심적인 역할을 Operator에 맡겨야 합니다.
첫번째로, MutatingWebhokConfiguration에서 Pod의 Annotation(ex, instrumentation.opentelemetry.io/inject-java: "true")을 확인하고 조건에 맞다면 Pod object에 Instrumentation을 주입합니다.
두번째로, ValidatingWebhokConfiguration에서 OpenTelemetryCollector, Instrumentation CRD가 올바른지 검사하고, 오류가 있다면 요청을 거부합니다.
이 2가지 외에도 더 필요하겠지만, OpenTelemetry에서 사용자가 Operator를 간단히 설치하고 관리할 수 있도록 OpenTelemetry Operator Chart를 제공하고 있으니 바로 설치하고 넘어가겠습니다.
1
2
3
helm repo add open-telemetry https://open-telemetry.github.io/opentelemetry-helm-charts
helm repo update open-telemetry
helm install operator open-telemetry/opentelemetry-operator --namespace otel-namespace --version "0.105.1"
추가로, OpenTelemetry Operator는 Pod 객체가 생성되거나 업데이트 될때 Dynamic Admission Control에서 리소스를 가로채 Operator의 핵심적인 역할이 수행되고 Kubernetes API server와 통신합니다. 이 과정에 TLS 인증서가 필요하여 cert-manager 설치를 권장하며, Operator 준비가 끝났습니다!
Collector
OpenTelemetry Collector는 특정 벤더에 종속되지 않고 원격 측정 데이터를 하나의 통합된 형식으로 수집하여 처리하고 전송하는 수집기입니다.
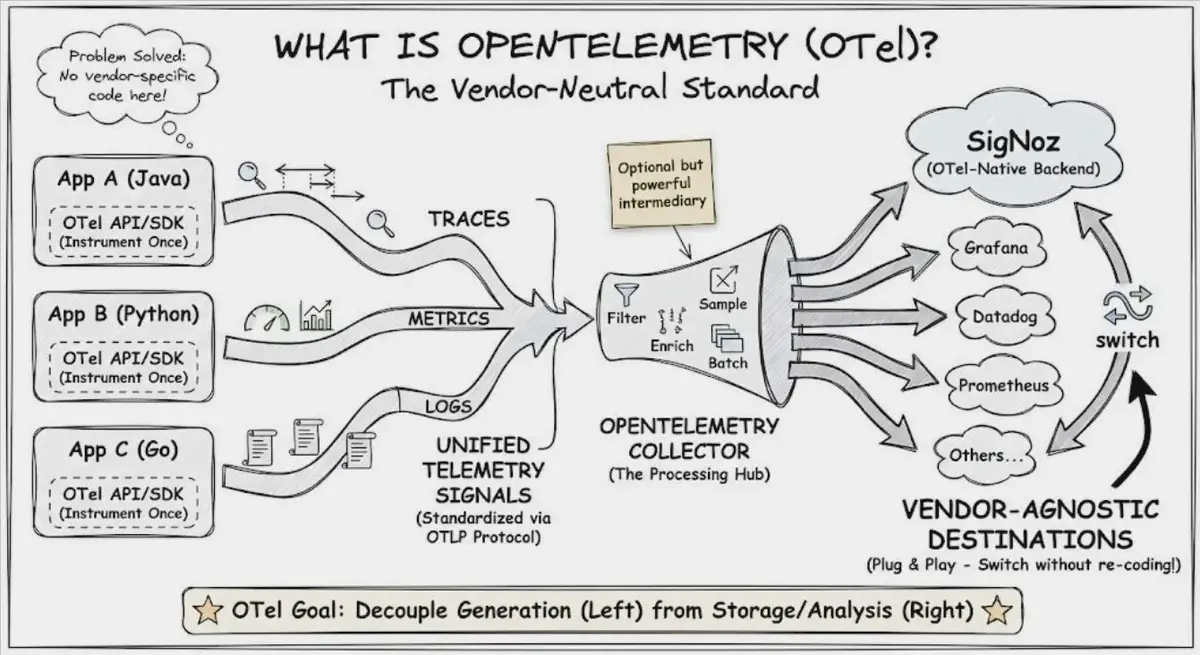
출처: https://signoz.io/opentelemetry/
OpenTelemetry에서는 Core와 Contrib 패키지를 조합하여 otelcol, otelcol-contrib, otelcol-k8s, otelcol-otlp, otelcol-ebpf-profiler 5가지 배포판을 지원하고 있으며, Operator Chart는 otelcol-k8s 배포판인 opentelemetry-collector-k8s를 사용하고 있습니다. 설치를 위해 collector.yaml을 준비하고 하나씩 살펴보며 추가해보겠습니다.
1
2
3
4
5
6
7
8
9
10
11
12
13
14
15
16
17
# collector.yaml
apiVersion: opentelemetry.io/v1beta1
kind: OpenTelemetryCollector
metadata:
  name: otel
spec:
  config:
    receivers:
    processors:
    exporters:
    service:
      pipelines:
        metrics:
        logs:
        traces:
  mode:
  serviceAccount:
Receivers
Receivers는 다양한 소스와 형태의 원격 측정 데이터를 수집하는 경로입니다. otelcol-k8s 배포판을 살펴보면 2개의 코어 컴포넌트와 18개의 확장 컴포넌트가 확인되며, 공식 문서의 Important Component for Kubernetes를 참고하여 필요한 컴포넌트만 아래와 같이 설정하고 수집해보겠습니다.
- OTLP Receiver : gRPC 또는 HTTP를 통해 OTLP 형태의 데이터를 수신합니다.
- Filelog Receiver : Kubernetes 로그 및 애플리케이션 로그를 stdout/stderr에 기록하여 수집합니다.
- Host Metrics Receiver : Kubernetes 노드에서 호스트 메트릭을 수집합니다.
- Kubernetes Cluster Receiver : 클러스터 수준의 메트릭과 엔티티 이벤트를 수집합니다.
- Kubernetes Objects Receiver : Kubernetes API 서버에서 이벤트와 같은 객체를 수집합니다.
- Kubeletstats Receiver : Kubelet의 API 서버에서 노드, 파드 및 컨테이너 메트릭을 가져옵니다.
1
2
3
4
5
6
7
8
9
10
11
12
13
14
15
16
17
18
19
20
21
22
23
24
25
26
27
28
29
30
31
32
# collector.yaml
spec:
  config:
    receivers:
      otlp:
        protocols:
          grpc:
            endpoint: 0.0.0.0:4317
          http:
            endpoint: 0.0.0.0:4318
      filelog:
        include: [/var/log/pods/*/*/*.log]
        include_file_path: true
        operators:
          - type: container
      hostmetrics:
        scrapers:
          cpu: { ... }
          disk: { ... }
          filesystem: { ... }
          load: { ... }
          memory: { ... }
          network: { ... }
      k8s_cluster:
        auth_type: serviceAccount
        metrics: { ... }
        resource_attribute: { ... }
      k8sobjects:
        auth_type: serviceAccount
      kubeletstats:
        auth_type: serviceAccount
        metrics: { ... }
Processors
Processors는 파이프라인을 통과한 원격 측정 데이터를 가공하는 경로입니다. otelcol-k8s 배포판을 살펴보면 1개의 코어 컴포넌트와 14개의 확장 컴포넌트가 확인되지만 여기서는 설명에 필요한 부분만 사용해보겠습니다.
- Filter Processor : 설정된 조건에 맞을 경우 원격 측정 데이터를 삭제합니다.
- Memory Limiter Processor : 주기적으로 메모리 사용량을 체크하고, 설정된 한계를 넘어설 경우 데이터 수신을 거부하고 GC를 동작시켜 메모리를 확보합니다.
- Kubernetes Attributes Processor : 원격 측정 데이터에 Kubernetes 메타데이터를 추가합니다.
- Transform Processor : 원격 측정 데이터를 수정합니다.
1
2
3
4
5
6
7
8
9
10
11
12
13
14
15
16
17
18
19
20
21
22
# collector.yaml
spec:
  config:
    processors:
      memory_limiter:
        check_interval: 1s
        limit_percentage: 80
        spike_limit_percentage: 15
      k8sattributes:
        auth_type: serviceAccount
      filter:
        metrics:
          metric: [...]
        logs:
          log_record: [...]
        traces:
          span: [...]
      transform:
        error_mode: ignore
        trace_statements: [...]
        log_statements: [...]
        metric_statements: [...]
Exporters
수집하고 가공한 MLT를 전송할 위치를 정의할 차례입니다. 우리는 원격 측정 데이터를 Gateway Collector로 보낼 계획이고, Batch Processor보다 Exporter의 배치 기능을 사용하기를 권장(prefer using the exporter’s batching capabilities)하여 다음과 같이 OTLP gRPC Exporter를 설정하였습니다.
1
2
3
4
5
6
7
8
9
10
11
# collector.yaml
spec:
  config:
    exporters:
      otlp_grpc:
        endpoint: gateway-collector:4317
        retry_on_failure:
          enabled: true
        sending_queue:
          enabled: true
          batch: {}
Pipelines
receivers, processors, exporters 설정이 완료되었으니, 마지막으로 Pipelines을 구성해야 합니다. 지금까지 설정한 Componets를 배치하여 MLT Pipeline을 아래와 같이 구성해보았습니다.
1
2
3
4
5
6
7
8
9
10
11
12
13
14
15
16
17
# collector.yaml
spec:
  config:
    service:
      pipelines:
        metrics:
          receivers: [otlp, hostmetrics, k8s_cluster, kubeletstats]
          processors: [memory_limiter, k8sattributes, filter, transform]
          exporters: [otlp_grpc]
        logs:
          receivers: [otlp, k8sobjects, filelog]
          processors: [memory_limiter, k8sattributes, filter, transform]
          exporters: [otlp_grpc]
        traces:
          receivers: [otlp]
          processors: [memory_limiter, k8sattributes, filter, transform]
          exporters: [otlp_grpc]
Mode
OpenTelemetry Collector에서 지원하는 Mode는 StatefulSet, Daemonset, Sidecar 3가지 모드입니다. 우리는 노드별 메트릭과 파일 로그 수집을 위해 Daemonset으로 설정하겠습니다.
1
2
3
# collector.yaml
spec:
  mode: daemonset
RBAC Authorization
Kubernetes에서 RBAC(Role-Based Access Control)란 누가 어떤 리소스에 대해 어떤 작업을 할 수 있는지를 결정하는 보안 규칙입니다. 앞서 설정한 Receivers와 Processors 컴포넌트 중 일부는 RBAC를 설정해야만 리소스 수집이 가능하므로 ServiceAccount부터 생성하겠습니다.
1
kubectl create serviceaccount --namespace otel-namespace otel-collector-sa
각 컴포넌트의 메뉴얼을 참고하여 수집할 metrics에 맞게 필요한 권한을 부여하여 ClusterRole을 생성하고
1
2
3
4
5
6
7
8
9
10
11
<<EOF | kubectl apply --namespace otel-namespace -f -
apiVersion: rbac.authorization.k8s.io/v1
kind: ClusterRole
metadata:
  name: otel-collector-role
rules:
- # See https://github.com/open-telemetry/opentelemetry-collector-contrib/tree/release/v0.144.x/receiver/k8sclusterreceiver#rbac
- # See https://github.com/open-telemetry/opentelemetry-collector-contrib/tree/release/v0.144.x/receiver/k8sobjectsreceiver#rbac
- # See https://github.com/open-telemetry/opentelemetry-collector-contrib/tree/release/v0.144.x/receiver/kubeletstatsreceiver#role-based-access-control
- # See https://github.com/open-telemetry/opentelemetry-collector-contrib/tree/release/v0.144.x/processor/k8sattributesprocessor#cluster-scoped-rbac
EOF
ClusterRole과 ServiceAccount를 연결시켜 권한을 부여하고
1
kubectl create clusterrolebinding otel-collector-binding --clusterrole=otel-collector-role --serviceaccount=otel-namespace:otel-collector-sa
설정이 끝난 ServiceAccount를 OpenTelemetry Collector에 연결시켜줍니다.
1
2
3
# collector.yaml
spec:
  serviceAccount: otel-collector-sa
Install
OpenTelemetry Collector의 모든 설정이 끝났으므로 설치를 진행하고 다음 단계로 넘어가 보겠습니다.
1
kubectl apply --namespace otel-namespace -f collector.yaml
Instrumentation
Instrumentation이란 소프트웨어의 동작을 관찰하고 측정하기 위해 코드 내에 측정용 도구를 추가하는 행위를 의미합니다. OpenTelemetry Instrumentation은 Zero-code와 Code-based 방식의 솔루션을 제시하고 있으며, OpenTelemetry Operator에서 제공하는 Auto-instrumentation은 Apache HTTPD, DotNET, Go, Java, Nginx, Node.js, Python 언어에 대해 공식 지원하고 있습니다.
Auto-instrumentation을 사용하려면 Instrumentation 리소스를 생성하고 관리하여야 하는데, 여기서는 코드의 변경을 최소화하고 효율적인 관리를 위해 하나의 리소스만 생성하겠습니다.
1
2
3
4
5
6
7
8
9
10
11
12
13
14
# instrumentation.yaml
apiVersion: opentelemetry.io/v1alpha1
kind: Instrumentation
metadata:
  name: instrumentation
spec:
  exporter:
    endpoint: http://otel-collector.otel-namespace.svc:4317
  propagators:
    - tracecontext
    - baggage
  sampler:
    type: parentbased_traceidratio
    argument: "1"
1
kubectl apply --namespace otel-namespace -f instrumentation.yaml
이렇게 생성된 Instrumentation은 Deployment에 추가하는 것으로 완료됩니다.
1
2
3
4
5
6
7
8
9
# java
spec:
  template:
    metadata:
      annotations:
        instrumentation.opentelemetry.io/inject-java: otel-namespace/instrumentation
    spec:
      containers:
        - name: java
해치웠나?
기본적인 설치를 마쳤지만, 급변하는 서비스 요구사항에 대응하거나 데이터 무결성을 보장하기에는 한계가 있었습니다. 이를 극복하고 유연성과 신뢰성을 한 단계 높여줄 개선 방안들을 살펴보겠습니다.
데이터 무결성 확보
Filelog Receiver는 수집 중인 File의 offset을 메모리에서 관리하므로, 프로세스 장애나 재시작 시 마지막 작업 시점을 파악할 수 없는 한계가 있었습니다. 이로 인해 start_at 조건에 따라 로그가 유실되거나 중복 수집되는 문제가 발생했습니다. OTLP gRPC Exporter 역시 데이터를 하위 엔드포인트로 전송하기 전까지 메모리에 적제하기 때문에, 동일한 장애 상황에서 원격 측정 데이터가 유실되는 취약점이 있었습니다.
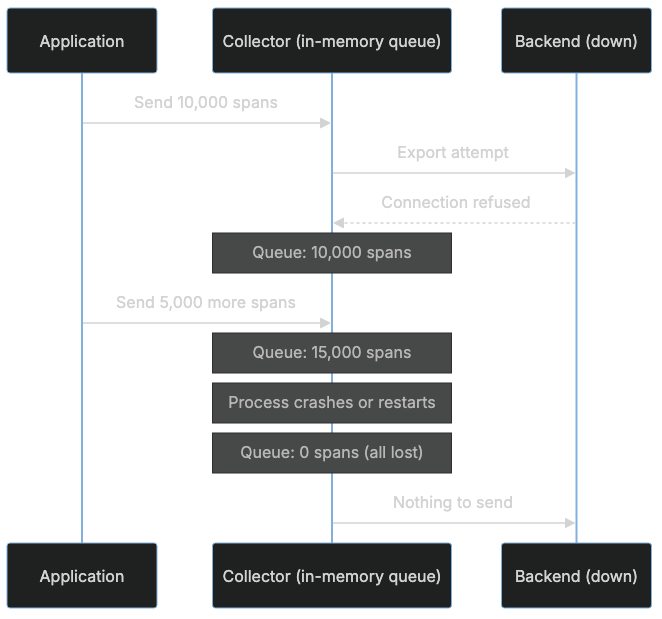
출처: https://oneuptime.com/blog/post/2026-02-06-persistent-storage-opentelemetry-collector-queues/view#the-problem-with-in-memory-queues
이러한 Collector 재시작, 백엔드 가용성 저하, 혹은 일시적인 네트워크 장애로 발생하는 데이터 손실을 방지하기 위해 File Storage Extention을 도입하여 저장 공간을 디스크로 전환하였습니다. 이를 통해 장애 상황에서도 데이터 지속성을 유지하고, 무결성을 확보할 수 있었습니다.
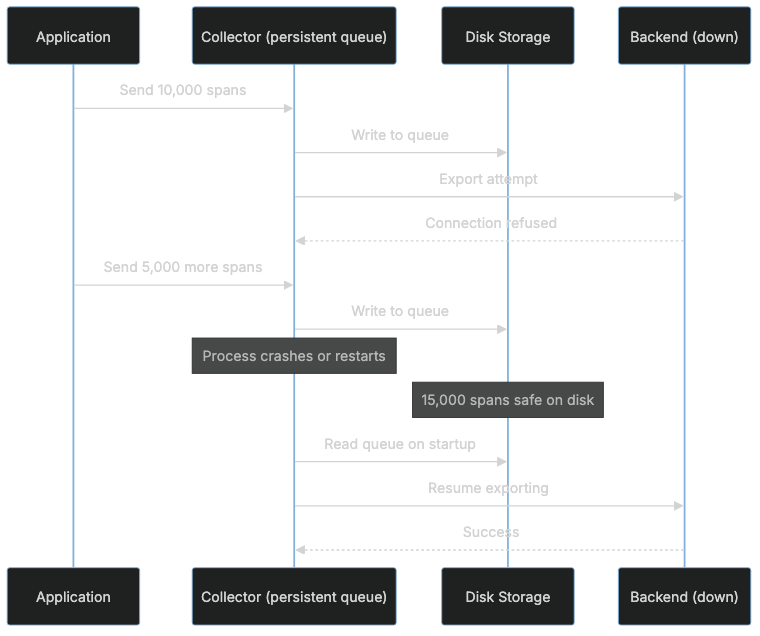
출처: https://oneuptime.com/blog/post/2026-02-06-persistent-storage-opentelemetry-collector-queues/view#the-problem-with-in-memory-queues
구체적인 방식은 아래의 collector.yam에서 확인할 수 있습니다.
1
2
3
4
5
6
7
8
9
10
11
12
13
14
15
# collector.yaml
spec:
  config:
    receiver:
      filelog:
        storage: file_storage
    exporters:
      otlp_grpc:
        sending_queue:
          storage: file_storage
    extensions:
      file_storage:
        directory: /var/lib/otelcol/file_storage
    service:
      extensions: [file_storage]
하위 호환성 확보를 위한 노력
기존 Kubernetes에서 운영중인 서비스는 Filebeat에서 지원하는 Hints base autodiscover를 적극 활용하여 Main Container와 여러 Sidecar Container의 로그 정책을 관리해 왔습니다. 하지만 OpenTelemetry Collector에는 Multiple containers나 Multiple sets of hints 기능을 기본적으로 지원하지 않아 정책 유지에 어려움이 있었습니다.
이에 기존 정책의 핵심 로직을 최대한 수용하여 전환 과정에 이질감을 최소화하고, 유예 기간을 두어 정책 전환 리스크를 체계적으로 관리하고자 합니다. 구체적으로는 Filebeat의 co.elastic.logs 접두사를 식별하여 기존 방식과의 하위 호환성을 보장하고, 순차적으로 OpenTelemetry의 resource.opentelemetry.io 접두사로 이행할 수 있도록 Processor를 구성하였습니다. 또한 pipelines 내 정책 적용 구간을 분리하여 처리 구조를 최적화하였습니다.
이러한 접근을 통해 기존 운영의 연속성을 유지하면서도, 복잡한 설정 변경 없이 자연스러운 전환이 가능한 환경을 구축하였습니다. 구체적인 구현 방식은 아래의 collector.yaml에서 확인할 수 있습니다.
1
2
3
4
5
6
7
8
9
10
11
12
13
14
15
16
17
18
19
20
21
22
23
24
25
26
27
28
29
30
31
32
33
34
35
36
37
38
39
40
41
42
43
44
45
46
# collector.yaml
spec:
  config:
    processors:
      k8sattributes:
        extract:
          otel_annotations: true
          annotations:
            - { from: pod, tag_name: $1, key_regex: resource.opentelemetry.io.(.*) }
            - { from: pod, tag_name: $1/filelogs.enabled, key_regex: co.elastic.logs.(.*)\/logs.enabled }
            - { from: pod, tag_name: filelogs.enabled, key: co.elastic.logs/enabled }
      filter/telemetry:
        metrics:
          metric:
            - resource.attributes["metrics.enabled"] == "false"
            - resource.attributes[Concat([resource.attributes["k8s.container.name"], "/metrics.enabled"], "")] == "false"
        logs:
          log_record:
            - resource.attributes["logs.enabled"] == "false"
            - resource.attributes[Concat([resource.attributes["k8s.container.name"], "/logs.enabled"], "")] == "false"
        traces:
          span:
            - resource.attributes["traces.enabled"] == "false"
            - resource.attributes[Concat([resource.attributes["k8s.container.name"], "/traces.enabled"], "")] == "false"
      filter/filelog:
        logs:
          log_record:
            - resource.attributes["filelogs.enabled"] == "false"
            - resource.attributes[Concat([resource.attributes["k8s.container.name"], "/filelogs.enabled"], "")] == "false"
      pipelines:
        metrics/telemetry:
          receivers: [otlp, hostmetrics, k8s_cluster, kubeletstats]
          processors: [memory_limiter, k8sattributes, filter/telemetry, transform]
          exporters: [otlp_grpc]
        logs/telemetry:
          receivers: [otlp, k8sobjects]
          processors: [memory_limiter, k8sattributes, filter/telemetry, transform]
          exporters: [otlp_grpc]
        logs/file:
          receivers: [filelog]
          processors: [memory_limiter, k8sattributes, filter/filelog, transform]
          exporters: [otlp_grpc]
        traces/telemetry:
          receivers: [otlp]
          processors: [memory_limiter, k8sattributes, filter/telemetry, transform]
          exporters: [otlp_grpc]
Container 맞춤형 로그 분석
기존 정책 중에는 다양한 로그 형식를 수집하기 위해 co.elastic.logs/processors.dissect.tokenizer에 정의된 패턴 기반의 처리 방식을 사용해왔습니다. 앞서 언급한 접두사 수준의 하위 호환성을 확보하였으나, 해당 패턴 처리 방식은 호환되지 않아 정책적 전환이 불가피했습니다.
이에 기존 패턴 처리의 편의성을 유지하면서도 기술적 한계를 극복하기 위해 다음과 같은 전략을 고안하였습니다. 우선 Transform processor에서 ExtractPatterns 함수를 활용하여 기존 Dissect 방식의 사용성을 재구현하였습니다. 그리고 정규표현식의 Named Capture Group에서 발생하는 특수문자 제한(알파벳, 숫자, 언더바만 허용) 문제를 해결하기 위해 replace_all_patterns 함수를 병행 사용하여 명명 규칙 제약을 우회하도록 설계하였습니다.
이러한 로직 역시 pipeline을 분리하여 collector.yaml에 구성함으로써 서비스별 정책 독립성을 보장하고 관리 효율을 최적화하였습니다. 구체적인 구현 방식은 아래의 설정에서 확인할 수 있습니다.
1
2
3
4
5
6
7
8
9
10
11
12
13
14
15
16
17
18
19
20
21
22
23
24
25
26
27
28
29
# collector.yaml
spec:
  config:
    processors:
      transform/file:
        log_statements:
          - context: log
            statements:
              - merge_maps(log.cache, ExtractPatterns(log.body, resource.attributes[Concat([resource.attributes["k8s.container.name"], "/filelogs.expr"], "")]), "insert") where IsString(resource.attributes[Concat([resource.attributes["k8s.container.name"], "/filelogs.expr"], "")])
              - replace_all_patterns(log.cache, "key", "___", "-")
              - replace_all_patterns(log.cache, "key", "__", ".")
              - merge_maps(log.attributes, log.cache, "upsert")
      pipelines:
        metrics/telemetry:
          receivers: [otlp, hostmetrics, k8s_cluster, kubeletstats]
          processors: [memory_limiter, k8sattributes, filter/telemetry, transform]
          exporters: [otlp_grpc]
        logs/telemetry:
          receivers: [otlp, k8sobjects]
          processors: [memory_limiter, k8sattributes, filter/telemetry, transform]
          exporters: [otlp_grpc]
        logs/file:
          receivers: [filelog]
          processors: [memory_limiter, k8sattributes, filter/filelog, transform/file, transform]
          exporters: [otlp_grpc]
        traces/telemetry:
          receivers: [otlp]
          processors: [memory_limiter, k8sattributes, filter/telemetry, transform]
          exporters: [otlp_grpc]
Filelog의 Observability 확보
기본적으로 Filelog Receiver는 수집한 로그를 Body에 저장하는 역할에 충실하기 때문에 최상위 속성값인 TraceId 및 SpanId 정보를 포함하지 않습니다. 이로 인해 수집된 로그가 트레이스 데이터와 단절되어 서비스 간 호출 맥락을 파악하는데 한계가 있었습니다.
이러한 문제를 해결하고 Observability를 확보하기 위해 앞서 정규표현식으로 추출한 속성 데이터 내에 trace_id, span_id, trace_flags가 존재할 경우 이를 OpenTelemetry의 표준 필드인 TraceId, SpanId, Flags로 매핑하는 과정을 추가하였습니다.
이러한 구조화된 데이터 변환을 통해 특정 벤더에 종속되지 않는 독립성을 유지함과 동시에 로그와 트레이스가 결합된 입체적인 모니터링 환경을 구축하였습니다. 구체적인 구현 방식은 아래의 collector.yaml에서 확인할 수 있습니다.
1
2
3
4
5
6
7
8
9
10
11
# collector.yaml
spec:
  config:
    processors:
      transform/file:
        log_statements:
          - context: log
            statements:
              - set(log.trace_id.string, log.attributes["trace_id"]) where IsString(log.attributes["trace_id"]) and Len(log.attributes["trace_id"]) == 32
              - set(log.span_id.string, log.attributes["span_id"]) where IsString(log.attributes["span_id"]) and Len(log.attributes["span_id"]) == 16
              - set(log.flags, Int(Double(log.attributes["trace_flags"]))) where log.attributes["trace_flags"] != nil
예를 들어, OpenTelemetry semantic conventions 속성값(HTTP, Network, URL)을 참고하여 resource.opentelemetry.io.nginx/filelogs.expr을 설정하면
1
2
3
4
5
6
7
8
9
10
11
# deployment.yaml
spec:
  template:
    metadata:
      annotations:
        instrumentation.opentelemetry.io/inject-nginx: otel-namespace/instrumentation
        resource.opentelemetry.io.nginx/filelogs.enabled: true
        resource.opentelemetry.io.nginx/filelogs.expr: "^(?P<client__address>\\S+) - (?P<http__request__header__remote___user>\\S+) \\[(?P<timestamp>.*?)\\] \"(?P<http__request__method>\\S+) (?P<url__path>[^?]+)(?:\\?(?P<url__query>[^ ]+))? (?P<network__protocol__name>[^/]+)/(?P<network__protocol__version>[^\"]+)\" (?P<http__response__status_code>\\d{3}) (?P<http__response__header__content___length>\\d+) \"(?P<http__request__header__referer>.*?)\" \"(?P<user_agent__original>.*?)\" \"(?P<http__request__header__x___forwarded___for>.*?)\" \"(?P<version>\\d{2})-(?P<trace_id>[a-zA-Z0-9]{32})-(?P<span_id>[a-zA-Z0-9]{16})-(?P<trace_flags>\\d{2})\"$"
    spec:
      containers:
        - name: nginx
아래와 같이 속성이 추출되어 Trace Context와 연결되었으며, 로그와 트레이스가 통합된 Observability가 확보되었습니다.
1
2
3
4
5
6
7
8
9
10
11
12
13
14
15
16
17
18
19
20
21
22
Trace ID    : 193c7f09d0efb97e3f4c4d47fad398f6  <-- 매핑 성공
Span ID     : df711874ed6077f8                  <-- 매핑 성공
Flags       : 1                                 <-- 매핑 성공
Body        : Str(192.168.0.1 - - [20xx-xx-xxTxx:xx:xx+09:00] "GET /index.html?query=string HTTP/1.1" 200 1146 "-" "curl/8.18.0" "192.168.0.1" "00-193c7f09d0efb97e3f4c4d47fad398f6-df711874ed6077f8-01")
Attributes  :
     -> client.address: Str(192.168.0.1)
     -> http.request.header.remote-user: Str(-)
     -> timestamp: Str(20xx-xx-xxTxx:xx:xx+09:00)
     -> http.request.method: Str(GET)
     -> url.path: Str(/index.html)
     -> url.query: Str(query=string)
     -> network.protocol.name: Str(HTTP)
     -> network.protocol.version: Str(1.1)
     -> http.response.status_code: Str(200)
     -> http.response.header.content-length: Str(1146)
     -> http.request.header.referer: Str(-)
     -> user_agent.original: Str(curl/8.18.0)
     -> http.request.header.x-forwarded-for: Str(192.168.0.1)
     -> version: Str(00)
     -> trace_id: Str(193c7f09d0efb97e3f4c4d47fad398f6)     <-- 추출 성공
     -> span_id: Str(df711874ed6077f8)                      <-- 추출 성공
     -> trace_flags: Str(01)                                <-- 추출 성공
Auto-instrumentation
OpenTelemetry Operator GitHub의 auto-instrumentation injecting 항목을 살펴보면 Go와 Nginx에 대한 계측 방법이 언급되어 있습니다. 하지만 공식 문서의 Injecting Auto-instrumentation 섹션에는 Go 언어에 대한 내용만 명시되어 있어, Nginx 환경을 구성할 때 혼선을 초래하기 쉽습니다.
OpenTelemetry Operator에서 Go와 Nginx 기능이 기본적으로 비활성화된 이유는 명확합니다. Go의 경우 eBPF(extended Berkeley Packet Filter) 기술을 사용하여 데이터를 수집하므로 Linux 커널 수준의 상위 권한이 필요하며, Nginx의 경우 실행 중인 특정 버전과 바이너리 모듈 간의 엄격한 호환성이 요구되기 때문입니다.
따라서 보안 정책과 시스템 안정성을 충분히 검토한 후, 아래와 같이 Operator 업그레이드 시 values.yaml 설정을 통해 해당 기능을 직접 활성화해야 합니다.
1
2
3
4
5
6
# operator.yaml
manager:
  extraArgs: ["--enable-nginx-instrumentation=true"]
  autoInstrumentation:
    go:
      enabled: true
1
helm upgrade operator open-telemetry/opentelemetry-operator --namespace otel-namespace --values operator.yaml
만약 기능 활성화 후 Go와 Nginx에 사용될 기본 이미지를 변경하고 싶다면, 아래와 같이 Instrumentation CRD를 업데이트하여 관리할 수 있습니다.
1
2
3
4
5
6
7
8
# instrumentation.yaml
spec:
  go:
    # See https://github.com/open-telemetry/opentelemetry-go-instrumentation/pkgs/container/opentelemetry-go-instrumentation%2Fautoinstrumentation-go
    image: ghcr.io/open-telemetry/opentelemetry-go-instrumentation/autoinstrumentation-go:v0.23.0
  nginx:
    # See https://github.com/open-telemetry/opentelemetry-operator/pkgs/container/opentelemetry-operator%2Fautoinstrumentation-apache-httpd
    image: ghcr.io/open-telemetry/opentelemetry-operator/autoinstrumentation-apache-httpd:1.0.4
최신 Nginx 사용 방법
Instrumentation의 .spec.nginx.image 설정을 살펴보면, 내부적으로 OpenTelemetry C++ Contrib instrumentation의 otel-webserver-module을 사용하여 라이브러리를 주입합니다. 하지만 현재 webserver/v1.0.4 기준으로는 1.24.0과 1.25.3 단 두 개의 Nginx 버전만 공식 지원하고 있어, 다른 버전을 사용할 경우 라이브러리 로드 실패 등 버전 불일치 문제가 발생할 수 있습니다.
운영 환경에서 다른 Nginx 버전을 사용해야 한다면, 상황에 맞는 다음 3가지 해결 방안을 검토해 보시기 바랍니다.
Case 1. otel-webserver-module 최신 버전 활용
webserver/v1.1.0 에서는 지원 범위가 확장되어 1.25.5과 1.26.0 버전을 지원합니다. 해당 버전을 직접 빌드하거나 GitHub Release에서 바이너리를 내려받아 설치하면, 해당 버전에서도 Auto-instrumentation이 가능합니다.
Case 2. OpenTelemetry nginx module 도입
OpenTelemetry에서 제공하는 otel_ngx_module을 사용하는 방식입니다. nginx/v0.1.1에서는 1.22.1, 1.24.0, 1.26.2, 1.27.1, 1.27.2, 1,27.3 6개의 버전을 지원하고 있으며, 소스 코드를 직접 빌드하거나 Release에서 모듈을 받아 불러오면 해당 버전에서도 Auto-instrumentation이 가능합니다. 자세한 설정은 GitHub에서 확인 가능합니다.
Case 3. NGINX Native OpenTelemetry Module (권장)
Nginx Inc.에서 공식 제공하는 ngx_otel_module을 사용하는 방식입니다. 소스 코드를 직접 빌드하거나 패키지 매니저를 통해 설치하여 원하는 버전에 적용할 수 있습니다. 특히 Nginx 1.25.4 이상의 최신 버전을 사용 중이라면, Docker Hub의 공식 Nginx 이미지(예: nginx:1.25.4-otel, nginx:1.28.2-otel)를 활용하는 것이 별도의 모듈 주입 과정 없이 가장 안정적이고 간편하게 도입할 수 있는 방법입니다. 자세한 설정은 NGINX 공식 문서에서 확인 가능합니다.
마치며
우리 팀이 OpenTelemetry를 도입하여 Observability를 강화한 이후, 운영 환경에는 괄목할 만한 변화가 있었습니다.
첫 번째로, MSA 전환 과정에서 급증한 서비스 간 호출 복잡도를 극복하고, 전체 시스템의 흐름을 명확히 시각화할 수 있게 되었습니다. 두 번째로, 과거에는 파악하기 어려웠던 병목 지점과 장애 전파 경로를 데이터 기반으로 정확히 특정할 수 있게 되었습니다. 그 결과, 서비스 장애 발생 시 평균 장애 복구 시간(MTTR)을 50% 이상 단축하였으며, 시스템 전반의 운영 안정성을 비약적으로 향상시켰습니다.
OpenTelemetry 공식 문서의 Language APIs & SDKs 항목에서 확인할 수 있듯이, OpenTelemetry는 매우 다양한 프로그래밍 언어에 대해 Instrumentation을 지원하고 있습니다. 현재 사용 중인 환경에 Auto-instrumentation 지원이 없더라도, SDK 설치와 최소한의 코드 수정만으로 충분히 구현이 가능합니다. 그러니 도입을 주저하지 마시고 OpenTelemetry가 제공하는 강력한 혜택을 꼭 경험해 보시길 권장합니다.
마지막으로, 이번 고도화 과정에서 많은 도움을 주신 SRE팀과 지칠 줄 모르는 열정으로 큰 힘이 되어주신 우리 팀원분들께 깊은 감사의 인사를 전합니다. 감사합니다.